
Solar panels are one of the most cost-effective ways to produce electricity, with solar energy cost dropping by more than 80% in the past 40 years.
Table Of Content
- Introduction
- New lows for solar installation costs in 2021
- What drives solar energy’s falling costs?
- How tax credits and incentives work
- Is solar at cost parity with the utility?
- How much can I save going solar?
- Should I install solar now or wait?
- Conclusion
- FAQ
- You May Also Like
- External Links
The cost of installing solar panels is expected to continue falling.
Since 2010, the price of installing solar panels has decreased by an astounding 65 percent.
Because of today’s low rates (and fantastic financing choices), anybody can install solar energy systems in their homes and begin saving money on their monthly energy bills. Just a decade ago, purchasing a solar installation was likely only possible for those who had a significant amount of wealth.
Getting a free estimate is the most accurate way to evaluate the total cost of your solar panel panels, including installation, as well as how much money you could save on your monthly electricity bill.
New lows for solar installation costs in 2021
The solar business consistently grabs the attention of the media with news of falling installation costs. The most recent astounding development came from the once-great SolarCity, which is now known as Tesla. At the beginning of this year, the company announced that it will charge just $2.50 per watt for solar systems, which is a record low. Because of the federal tax credit of 30%, the cost of installing solar panels has dropped to about $1.75 per watt.
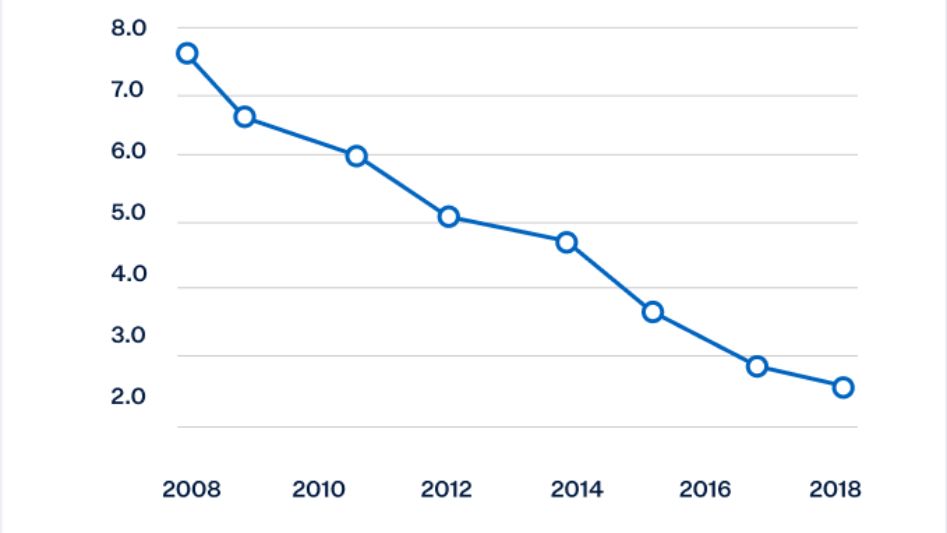
In 2010, the average cost of installing solar energy systems in residential homes was $7.34 per watt. Consequently, Tesla only costs $20,000 for the installation of an 8-kilowatt system, but the same installation in 2010 would have cost $58,720.
Since 2010, unsurprisingly, the price of installation has been continuously decreasing each year. The National Renewable Energy Laboratory in Colorado provides data on solar installation costs on an annual basis, with the most recent publication being the Q1 2018 Solar PV System Cost Benchmark. According to estimations provided by NREL, the typical installation cost in 2018 was only $2.70 per watt, as seen in the graphic that may be found below. In just eight years, that amounts to a decrease in the cost of 65 percent.
However, most installers are not quite there yet, and in reality, solar installation prices can run as high as $3 per watt. Although Tesla’s installation cost of $2.50 per watt is attention-grabbing, most installers are not quite there yet. It’s possible that a difference of $0.50 won’t seem like much, but if you install an 8kW system, it means you’ll have to fork out an additional $4,000.
What drives solar energy’s falling costs?
If you take a look at the chart that is located above, you will notice that the fast-decreasing cost of solar panels itself is the single most important factor that contributes to the reducing cost of solar energy. This is primarily due to production economies of scale and inexpensive imports. In 2010, the cost of solar panels, also known as modules, accounted for around 35 percent of the total installation expenses. These very same panels now account for just 15% of the total cost of installation.
The price of solar panels was approximately $2.50 per watt in 2010, but by the beginning of 2017, that price has dropped to just $0.38 per watt. Early in 2018, panel prices climbed by almost 20%, which was roughly the same time as the United States began taking steps to levy taxes on imported solar panels. However, panel prices have subsequently resumed their previous downward trend.
The trend of decreasing prices for solar panels is so well known in the solar business that it even has its name: Swanson’s Law. Swanson’s Law, which was popularised in an article published in 2012 in The Economist, argues that the price of solar panels would typically reduce by 20% if there is a doubling of the number of solar panels shipped all over the world. In the actual world, this translates to a cost reduction of approximately ten percent per year.
Nobody knows for sure how much longer prices will keep going down, but market analysts believe the trend may be coming to an end shortly. The price of solar panels has only decreased by 2.3% in 2019, but Forbes predicts that prices will soon reach their rock-bottom level as the Chinese industry continues to stabilise.
The solar industry analysis firm GTM forecasts that home solar installation prices will bottom out at $2.50 per watt. This is a value that Tesla has already obtained, and, probably, other installers are also attempting to figure out. Installers will need to place a greater focus on lowering operating and installation costs, streamlining the installation process, and working towards reducing the often exorbitantly high permitting fees if the industry wants to continue this downward trend in cost that we have all come to expect. If the industry wants to continue this downward trend in cost, we have all come to expect it.
How tax credits and incentives work
When rooftop solar was still in its infancy in the 2000s, the federal government, along with numerous states and cities, saw the benefits of renewable energy, specifically the financial savings and low emissions, and decided to assist the industry by offering tax credits, rebates, or other financial incentives. This was done to encourage more people to switch to renewable energy sources. The majority of these incentives were planned to progressively expire as the cost of solar energy moved closer to that of utility prices. These incentives were aimed to make solar energy more accessible to a greater number of homeowners, which would help the fledgling solar sector.
In 2019, many of these bonuses have already run their course, but there are a few excellent ones that are still floating around out there somewhere.
The largest solar incentive that is now available is the federal tax credit of thirty percent, which is known as the Investment Tax Credit (ITC). Because of this credit, you will be able to deduct thirty percent of the whole cost of installing solar panels from your federal income tax return.
For instance, if you spent $16,000 for your installation, you might be eligible for a credit of $4,800 when you file your taxes on that amount. The ITC provides savings on your installation equal to one dollar for every dollar that is claimed as a credit rather than as a deduction. On the other hand, because it is a credit that is not eligible for a refund, it can only reduce your tax liability to zero dollars; the federal government will not issue a refund to you based on this credit alone. However, the credit may be taken in stages over several years rather than all at once.
2019 was the final year that a full 30% credit could be claimed. The value of the tax credit was reduced to 26% at the commencement of the year 2020. In 2021, it fell even further to 22%, and then in 2022, it fell to 10%. After then, you’re out of luck!
The federal tax credit is not the only incentive that might help you bring down the costs of installing solar panels on your roof. Incentives to install solar panels can be found nationwide, both in individual cities and states. For example, Colorado Springs Utilities provides rebates for home solar installations at a rate of $0.20 per watt. Depending on the size of the system, the City of San Francisco offers between $200 and $500 per kW.
Other municipalities and states provide tax exemptions for solar equipment and installation costs in the form of property tax exemptions or sales tax exemptions, while others provide income tax credits that are analogous to the ITC. Be sure to ask your solar installation for a breakdown of the many incentives that are available in your region, as they will have an in-depth knowledge of all of the programmes that are applicable in your location.
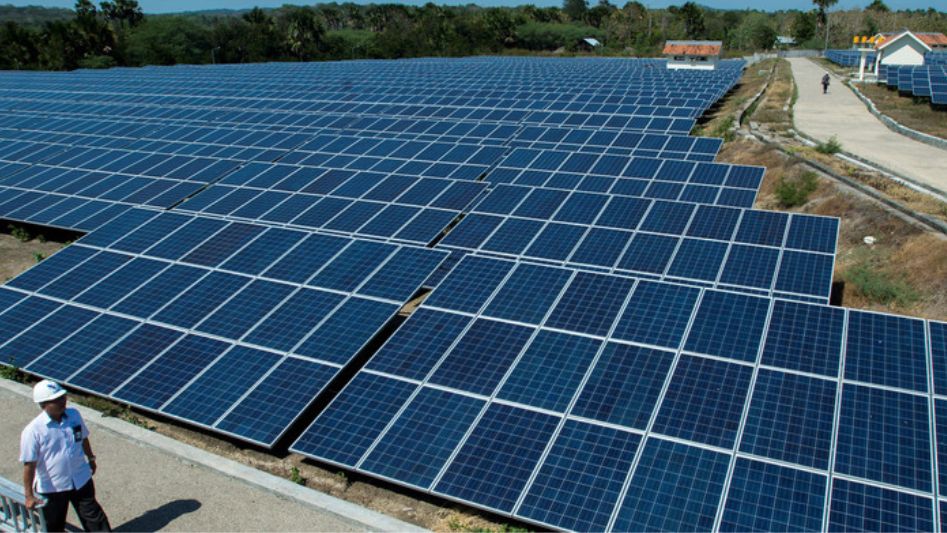
Solar power is on the rise, although it only accounts for a small percentage of overall generating.
Even while solar and other forms of renewable energy have experienced explosive growth over the past twenty years, they still account for a very small percentage of the total electricity generation in the United States.

The total amount of solar electricity that was generated by utilities in the United States in 2009 was only 28 gigawatt-hours (GWh), but by 2018 that number had climbed to 5,252 GWh. That is a growth that is equivalent to 19,000%!
During the same period, there was a precipitous decline in the price of coal. In 2009, coal was responsible for the generation of more power than any other fuel type, totalling 1.3 million GWh. By the year 2018, this figure has decreased by 35% to approximately 860,000 GWh.
Its fall from favour was quite dramatic, and it hasn’t exactly recovered since then. Despite this, coal continues to play a significant role in the generation of our nation’s electricity. According to figures provided by the EIA, even in 2019, coal continues to account for over a third of our total power output, whilst solar contributes only 0.28% of the total.
When one takes a broader view of renewable energy sources, such as wind and hydroelectricity, the prognosis is somewhat more favourable. Huge portions of the country are currently being powered by these sources. Around fifteen percent of the world’s electricity supply is expected to come from various sources of renewable energy in 2019. It was the first time in history that renewable energy (including hydro) surpassed coal in April and May of 2019, and the EIA predicts that renewables will permanently overtake coal by the year 2031. This prediction is being driven by lowering pricing for renewable energy sources.
Even if the solar industry has had explosive growth over the past decade, we cannot hope to save the planet so long as fossil fuels continue to provide the majority of our nation’s electricity. Quite a few states and municipalities are getting behind in efforts to harness the maximum amount of renewable and clean energy possible. Get ready to make a lot more money off of solar and wind power since four different states, Hawaii, California, New Mexico, and Washington, have all committed to using only clean or renewable energy within the next few decades.
Is solar at cost parity with the utility?
This is the most important question that the solar business asks consistently. Is it more cost-effective to install solar panels than to buy electricity from a utility company?
This concept, which is sometimes referred to as grid parity, is what the entire solar industry is working to achieve at present. There is nothing that can stop rooftop solar from taking over the globe once it reaches the point where it is less expensive to continue purchasing electricity than it is to buy and install a solar power system on one’s roof, even in the absence of any financial incentives.
As of the year 2019, residential rooftop solar is cost-competitive with utilities in many places around the United States, although this is not the case everywhere.
The first piece of good news is that the price of large-scale solar installations (those that are owned by utilities) has not only caught up to the price of conventional fuels, but it is lower. Lazard, a consulting business, does an annual analysis of the “life-cycle cost” of various sources of power. They call this their “Levelized Cost of Energy,” and it takes into account the price of building and maintaining facilities as well as the cost of fuel.
It was discovered that the price of unsubsidized utility-scale solar was $36 per MWh in 2018, whereas the price of natural gas was $41 per MWh and the price of coal was $60 per MWh. When financial incentives are factored in, such as the federal tax credit, the price of utility-scale solar energy falls even further, reaching just $32 per MWh. Even when compared to maintaining operations at existing coal facilities, solar energy is proving to be more financially viable for utilities. Utility companies all around the United States are shuttering coal plants earlier than planned in favour of cheaper and cleaner renewable energy or natural gas. For instance, Xcel Energy announced in May 2019 that it has decided to shut down two coal facilities in Minnesota by the year 2030. This decision was made in favour of energy-saving initiatives and new wind generation.
When viewed from the point of view of a homeowner, the situation takes on a somewhat different complexion. According to the same study, Lazard believes that the cost of residential rooftop solar, after taking into account applicable tax credits and rebates, is between $0.15 and $0.25 per kWh. For $0.15 per kWh, that is grid parity in approximately 10 states across the United States, the majority of which are located in the west, the northeast, and Hawaii.
Outside of these 10 states, solar energy can compete favourably with the prices charged by utilities. As an illustration, let’s imagine that we put in a solar system in Colorado that had a capacity of 6 kW, which is considered to be of a medium scale. For three dollars per watt, the total investment comes to eighteen thousand dollars.
After taking into account the annual production losses that occur as a result of wear and tear on the panels, a well-positioned 6 kW installation in Denver will generate around 9,622 kWh per year and approximately 218,800 kWh throughout its 25-year lifespan.
Taking into account your entire production and your original investment of $18,000, the cost of your solar electricity would be approximately $0.08 per kWh. Not too shabby taking into account that the typical home electricity tariff in Colorado is around $0.12 per kWh.
In states like California, Hawaii, and New York, where utility rates are quite high, the price of solar electricity is significantly lower than the grid parity price. This is the reason why homeowners in those states are adopting solar energy in such large numbers. In other places, like Colorado, it usually makes good sense to do so, provided that the price of installation is not through the roof. In jurisdictions that have low utility rates, such as Idaho and Washington (both of which have low utility rates thanks to cheap hydroelectric power), the financial benefit of solar energy must be determined on a case-by-case basis. This is especially true in areas like Idaho and Washington.
How much can I save going solar?
In the last illustration, we determined that a homeowner in Colorado might save approximately $23,000 by installing solar panels on their property. However, these savings throughout a lifetime might range anywhere from $5,000 up to more than $40,000.
Why is there such a large variation? The amount of money you can save by installing solar panels is determined by a wide range of factors, some of which are as follows: 1) the expense of installing the panels; 2) the amount of electricity generated by the solar panels; 3) the price of electricity in your area, and 4) how you finance the project.
If you feel that is a sufficient explanation for you, you can move on to the following part if you so choose. Continue reading if you are interested in gaining some additional insight into how all of these things influence your ability to save money. Let’s take a closer look at each one of these in further detail.
1) The Cost of Installation: Although we have previously looked at the typical cost of installation in the parts that came before, it is important to keep in mind that the real costs of installing solar panels can vary greatly depending on your location and the contractor that you choose. In areas like California, where wages, permission fees, and/or overhead are all greater, costs are more likely to be higher overall. Although NREL estimates that the typical installation cost is approximately $2.70 per watt, expenditures may rise to $3.00/watt or even more in certain geographic locations. A difference of $0.30 may not seem like much, but shopping around for the best deal can save you thousands of dollars right off the outset. Talking to a few different installers will help you locate the best deal.
2) Electricity Production: Because you won’t be using the expensive electricity provided by the utility company, the more solar energy you produce, the more money you’ll save because you won’t have to pay for that electricity. Both the size of your installation and its location in the world play a significant role in determining the total amount of electricity it generates. An installation with a capacity of 6 kilowatts (kW) will create approximately 10,165 kilowatt-hours (kWh) of power in the first year in the state of Arizona, but the same installation in the state of Minnesota will produce 7,993 kWh. This does not mean that installing solar panels in Minnesota is a waste of money; rather, it means that a homeowner in Arizona can anticipate a higher rate of return on their investment.
3) The Cost of Your Utilities: When determining the cost-effectiveness of your solar installation, one of the most important elements to consider is the cost of your utilities. Every kilowatt-hour of power that is generated by your solar system is a kilowatt-hour that does not need to be purchased from the local utility company. Keeping this in mind, if you reside in California, where the average rate charged by utilities is $0.18 per kWh, you will see a far quicker return on your investment in solar energy than you would if you lived in Idaho, where the average rate charged by utilities is approximately $0.10 per kWh. Again, this does not imply that installing solar panels in Idaho is a waste of money; rather, it just means that homeowners in California may anticipate a higher rate of return on their solar investment.
Another significant aspect that goes into calculating your overall savings throughout your lifetime is the rate at which you pay for utilities. Naturally, there is a large amount of variation in the rate at which utilities increase their rates. Utilities in the United States have, on average, added 2.6% to the cost of energy each year over the past 15 years. Nevertheless, that ranged from 1.4% in Maine and Louisiana to 4.6% in Hawaii. Hawaii had the highest rate. Installing solar panels will allow you to save more money the faster your energy use goes up. The rate of increase can have a significant impact on the total amount of money you save throughout the lifetime of your solar installation, which is typically 25 years.
If the entirety of this seems daunting to you, there is no need to worry about it! When you call local solar installers for estimates, every solar installer worth their weight will set out the current pricing of your utility as well as its annual rate of increase. This is something that you should expect from any solar installation you hire.
4) Financing: Your ability to secure financing is the final factor that has an impact on your savings. If you pay for your installation with cash, you will receive the greatest financial return on your investment. If you pay with cash, though, your bank account will, of course, sustain a very significant loss. We are fortunate to have a variety of choices at our disposal.
As the use of solar energy in private homes has grown in popularity, an increasing number of financial institutions, including banks and credit unions, have begun providing borrowers with access to low-interest loans to install solar panels. You also have the option of obtaining a Home Equity Line of Credit or Loan to pay for the installation of your new system. Although you won’t be able to squander your nest egg, your total savings will be lesser because you’ll have to pay that annoying interest. However, you won’t have to spend it either.
Solar leases are another possibility, but they typically result in the lowest return on investment compared to the other solar financing choices, therefore we do not advocate going that route.
There are even more aspects that affect your solar savings than the four that were mentioned above. For instance, financial incentives such as the federal tax credit or utility rebates can help you save more money. Additionally, you must be familiar with the net metering legislation that applies in your state. However, your total solar savings will be significantly affected by the aforementioned four elements.
Contacting a few different solar contractors is the easiest method to receive an accurate estimate of both the cost and the savings that will result from installing solar panels on your roof. Since each solar installation is uniquely designed and constructed, Free estimates are provided by every solar company, regardless of how large or little, they are. Some businesses even make use of internet tools that enable them to remotely estimate your costs and savings, which means that they do not need to come to your home or make an appointment with you.
If you reside in a region where solar panels are frequently installed, there is a good chance that you, too, could benefit financially from doing the same thing. There has been a significant reduction in the cost of solar energy over the past decade; however, this may no longer be the case because the price of solar panels has reached a new low and financial incentives are continuing to dwindle. If you are considering switching to solar energy, it is in your best interest to make the switch within the next year or two to take advantage of the federal Investment Tax Credit before it is eliminated.
Should I install solar now or wait?
After reading about how the price of solar energy continues to drop, you’ve undoubtedly started to wonder if you could get an even higher return on your investment if you put off purchasing solar energy for a while and wait until the price drops even further. After all, it is highly likely that the price of installation will decrease even further within the next five to ten years. That makes sense, doesn’t it?
Even though the cost of solar panels might go down much more and that solar panel installation might become even more streamlined and effective, the debate is moot. The greatest time to invest is right now – not the day after tomorrow. Saving a dollar now will save you a dollar later.
As of 2019, the typical payback period for a solar installation ranges from eight to twelve years, though this might vary depending on the rates charged by your utility company and the location of your property. Because solar panels have a lifespan of about 25 years, it will take you anywhere between 13 and 17 years to start seeing the financial benefits of having access to totally free renewable energy.
Let’s take a second look at the state of Colorado as an illustration of payback periods so that we may gain some further perspective. After accounting for the ITC, the total investment of an installation that generates around 9,600 kWh per year comes to $12,600. Because utilities in Colorado charge an average of $0.12 per kWh, you are saving yourself an annual utility cost of $1,150 by not using them. At that rate, it would take you roughly 11 years to return your initial investment, which would provide you with 14 more years to enjoy at no additional cost. If you generate your renewable energy over 14 years, you will have saved roughly $23,000 by that point.
Conclusion
There is little question that the usage of solar energy as a source of power for residential, commercial, and industrial applications will continue to expand in the years to come as a result of ongoing technological advancements and the introduction of ever more inventive applications. The solar power technologies that are in use today have reached an intriguing crossroads, and a new renaissance is just around the bend. In the meanwhile, it is a fair bet that both the efficiency of solar panels and the application of solar technology in residential settings will continue to increase.
FAQ
Have costs associated with solar energy become more affordable?
Over the previous decade, manufacturers have succeeded in bringing down the cost of solar panels, inverters, and lithium batteries. For many years, it is anticipated that prices will continue to fall.
Is there exponential growth in solar?
These models frequently assume that the expansion of renewable energy sources like solar and wind will be linear. However, in reality, the growth has been exponential.
Is there an upward or downward trend in the price of solar energy?
According to the Solar Energy Industries Association (SEIA), the price of residential solar panel systems has decreased by an annual average of more than 60% over the past decade. This represents a price reduction from more than $50,000 for a 6-kilowatt-hour (KWh) system in 2011 to somewhere between $16,000 and $21,000 in 2022 for the same size of the system.
You May Also Like
- CAN SOLAR PANELS BE THE POWER SOURCE FOR FARMING?
- EVERYTHING YOU NEED TO KNOW ABOUT SOLAR ENERGY
- IS SOLAR ENERGY RENEWABLE OR NONRENEWABLE?
- HOW RENEWABLE IS SOLAR ENERGY? THE UNBELIEVABLE FACTS
- SOLAR OR WIND ENERGY? DO YOU KNOW WHICH ONE TO CHOOSE IN 2022?